Dashboard Proposal
TLDR
We already can download Multi-Steady-State data using the search bar (PR). However, once you've got a big table you want a Business Intelligence (BI) tool to help graph it etc. Making one of those is a lot of work, so it'd be good if we can just use an open source one, if theres a way that we can directly integrate it with the platform.
A couple of options
Just Use Excel
"If there's one thing every process engineer can use, it's Excel" - Ben
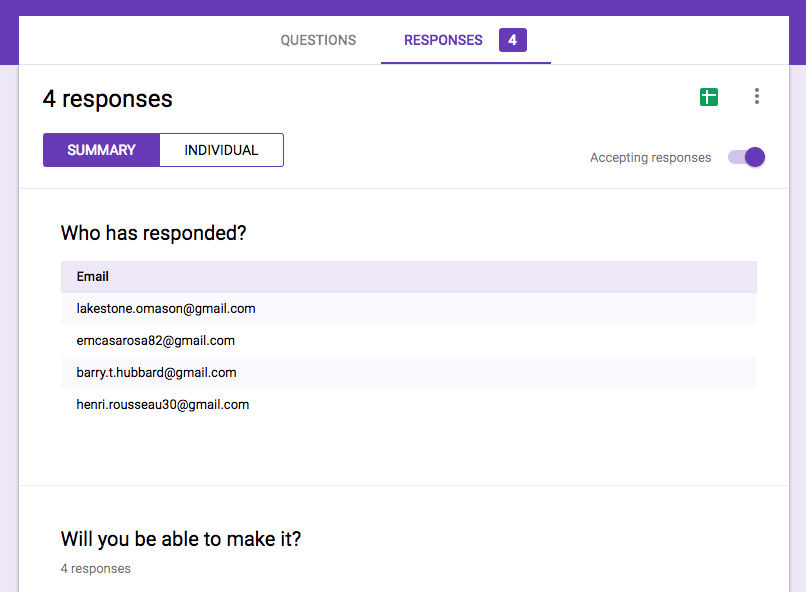
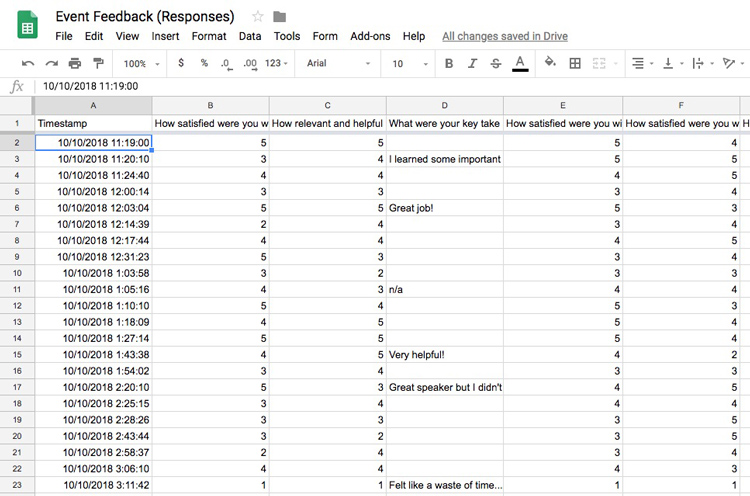
We could just make it that whenever you press "Run" in the flowsheet on MSS, it updates the data in a table in Excel - similar to how Google Forms results automatically get added to a spreadsheet.
This means that you can use all the excel analysis tools, charts, pivot tables, whatever you like. This is also something that other people are already familiar with.
UPDATE:We did this
Include some sort of Business Intelligence (BI) Tool
The other main data processing tool would be something like PowerBI. There are lots of open source ones, something like Lightdash or Metabase could work. Generally they connect to a database, we could make a modified version that is pre-setup to connect to a specific flowsheet's MSS database and then they could be included inside our platform. Or, we could expose a postgres view of the data so they can connect an external tool of their choosing.
This approach is similar to how we plan to handle live data, where we stream data live to a scada system such as thingsboard and the visualisation can be done there. SCADA systems have good dashboard tools, but are more focused on time-series which wouldn't be appropriate for if we are doing seperate cases.
Make our own dashboard.
We could do this, building off some good graphing libraries and so forth. However, that'd still be a lot of work, especially if we want people to be able to customise it (we definitely will). I don't think we should implement more than basic graphing tools such as we have now.
What this is not
This is not saying that we shouldn't include any sort of visualisation tools on the flowsheet. We can still color streams based on temperature, change their width based on flow, etc, and have key properties shown below the unit operations. But that is to view the current state of the flowsheet, not all states at the same time. They are different problems. See Next Gen Flowsheet